RISK FACTOR
Creating an Interactive Map for Nationwide Property Coverage.
Risk Factor displays climate risk for over 142 million properties in the United States. With a simple address search, users can access advanced climate data for both residential and commercial properties. Here’s how we designed a new interactive map experience to ensure every property in the country is accessible through an address search.
Identifying Issues and Designing Solutions
Fast-Track Design by Identifying and
Understanding Tool Gaps
Leveraging our team’s institutional knowledge about the capabilities and limitations of maps, we were confident in our ability to understand our users’ needs and identify gaps in our tool. With a clear definition of the problem, we were well-positioned to dive into the design process.
Alert Designs
Notifications
Popups
Banners
We Explored How to Notify Users of Address Search Issues
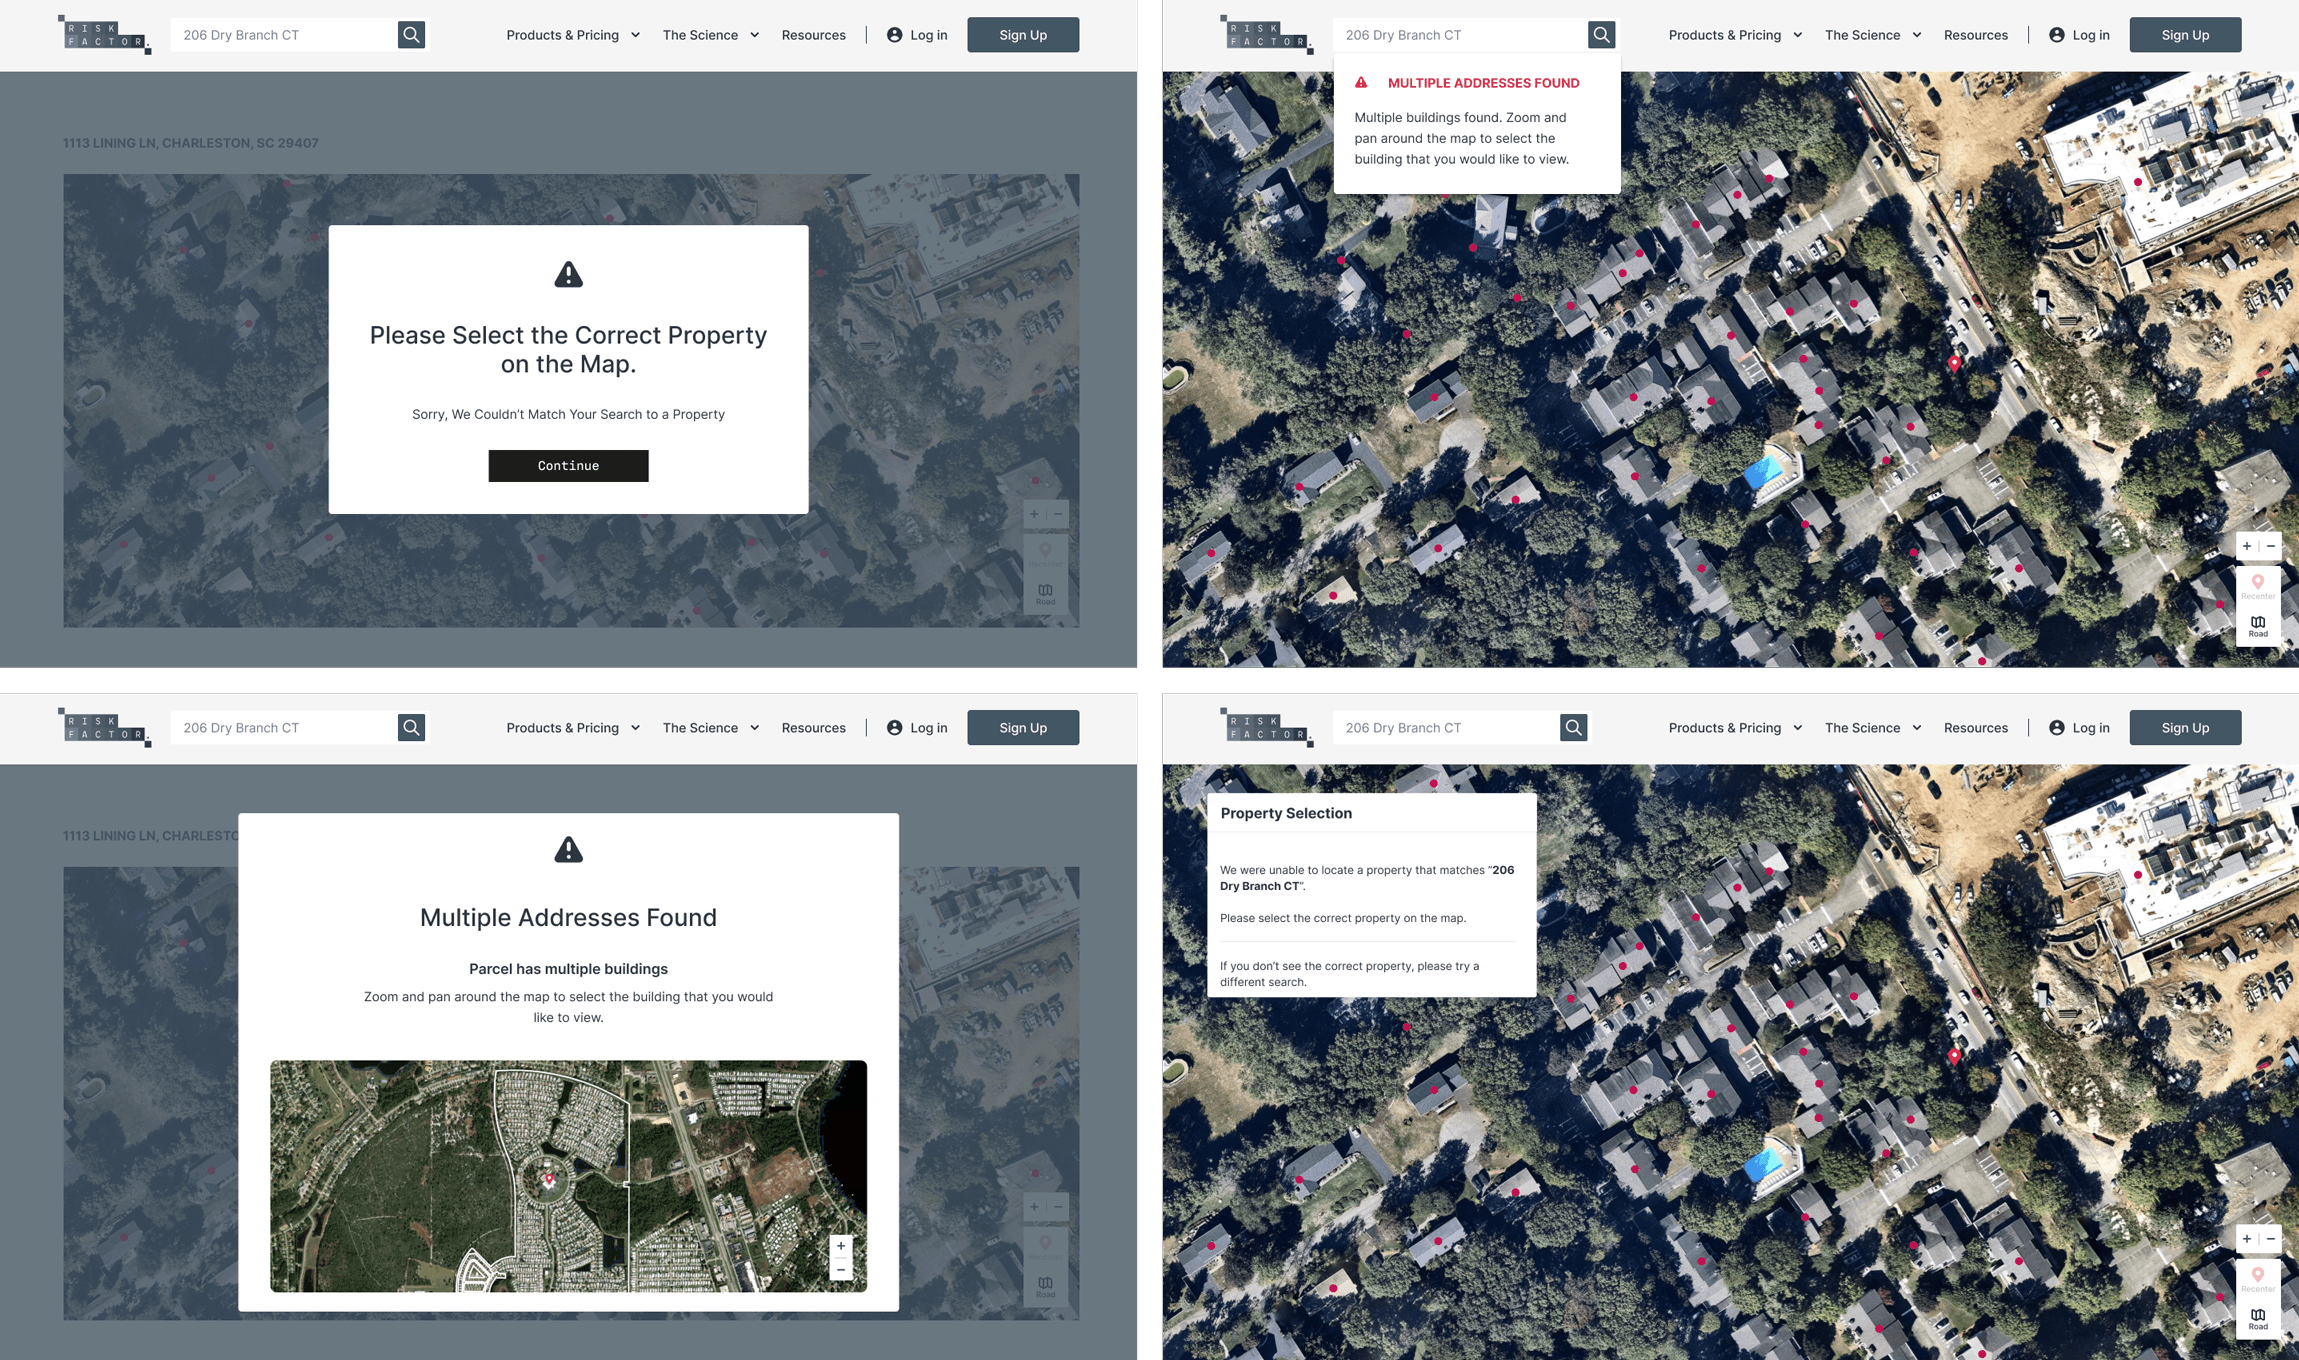
Working within the constraints of our design system to ensure speed, we explored various methods to alert users about issues with their address search. We utilized modals, interactive map modals, and search bar error messages to effectively inform users of any problems. These approaches aimed to provide clear and immediate feedback, enhancing the user experience despite the encountered issues.

Dynamic Map Interfaces
Clustering
Panning
Zooming
Property Outlines
Finding a Way to Select the Correct Property
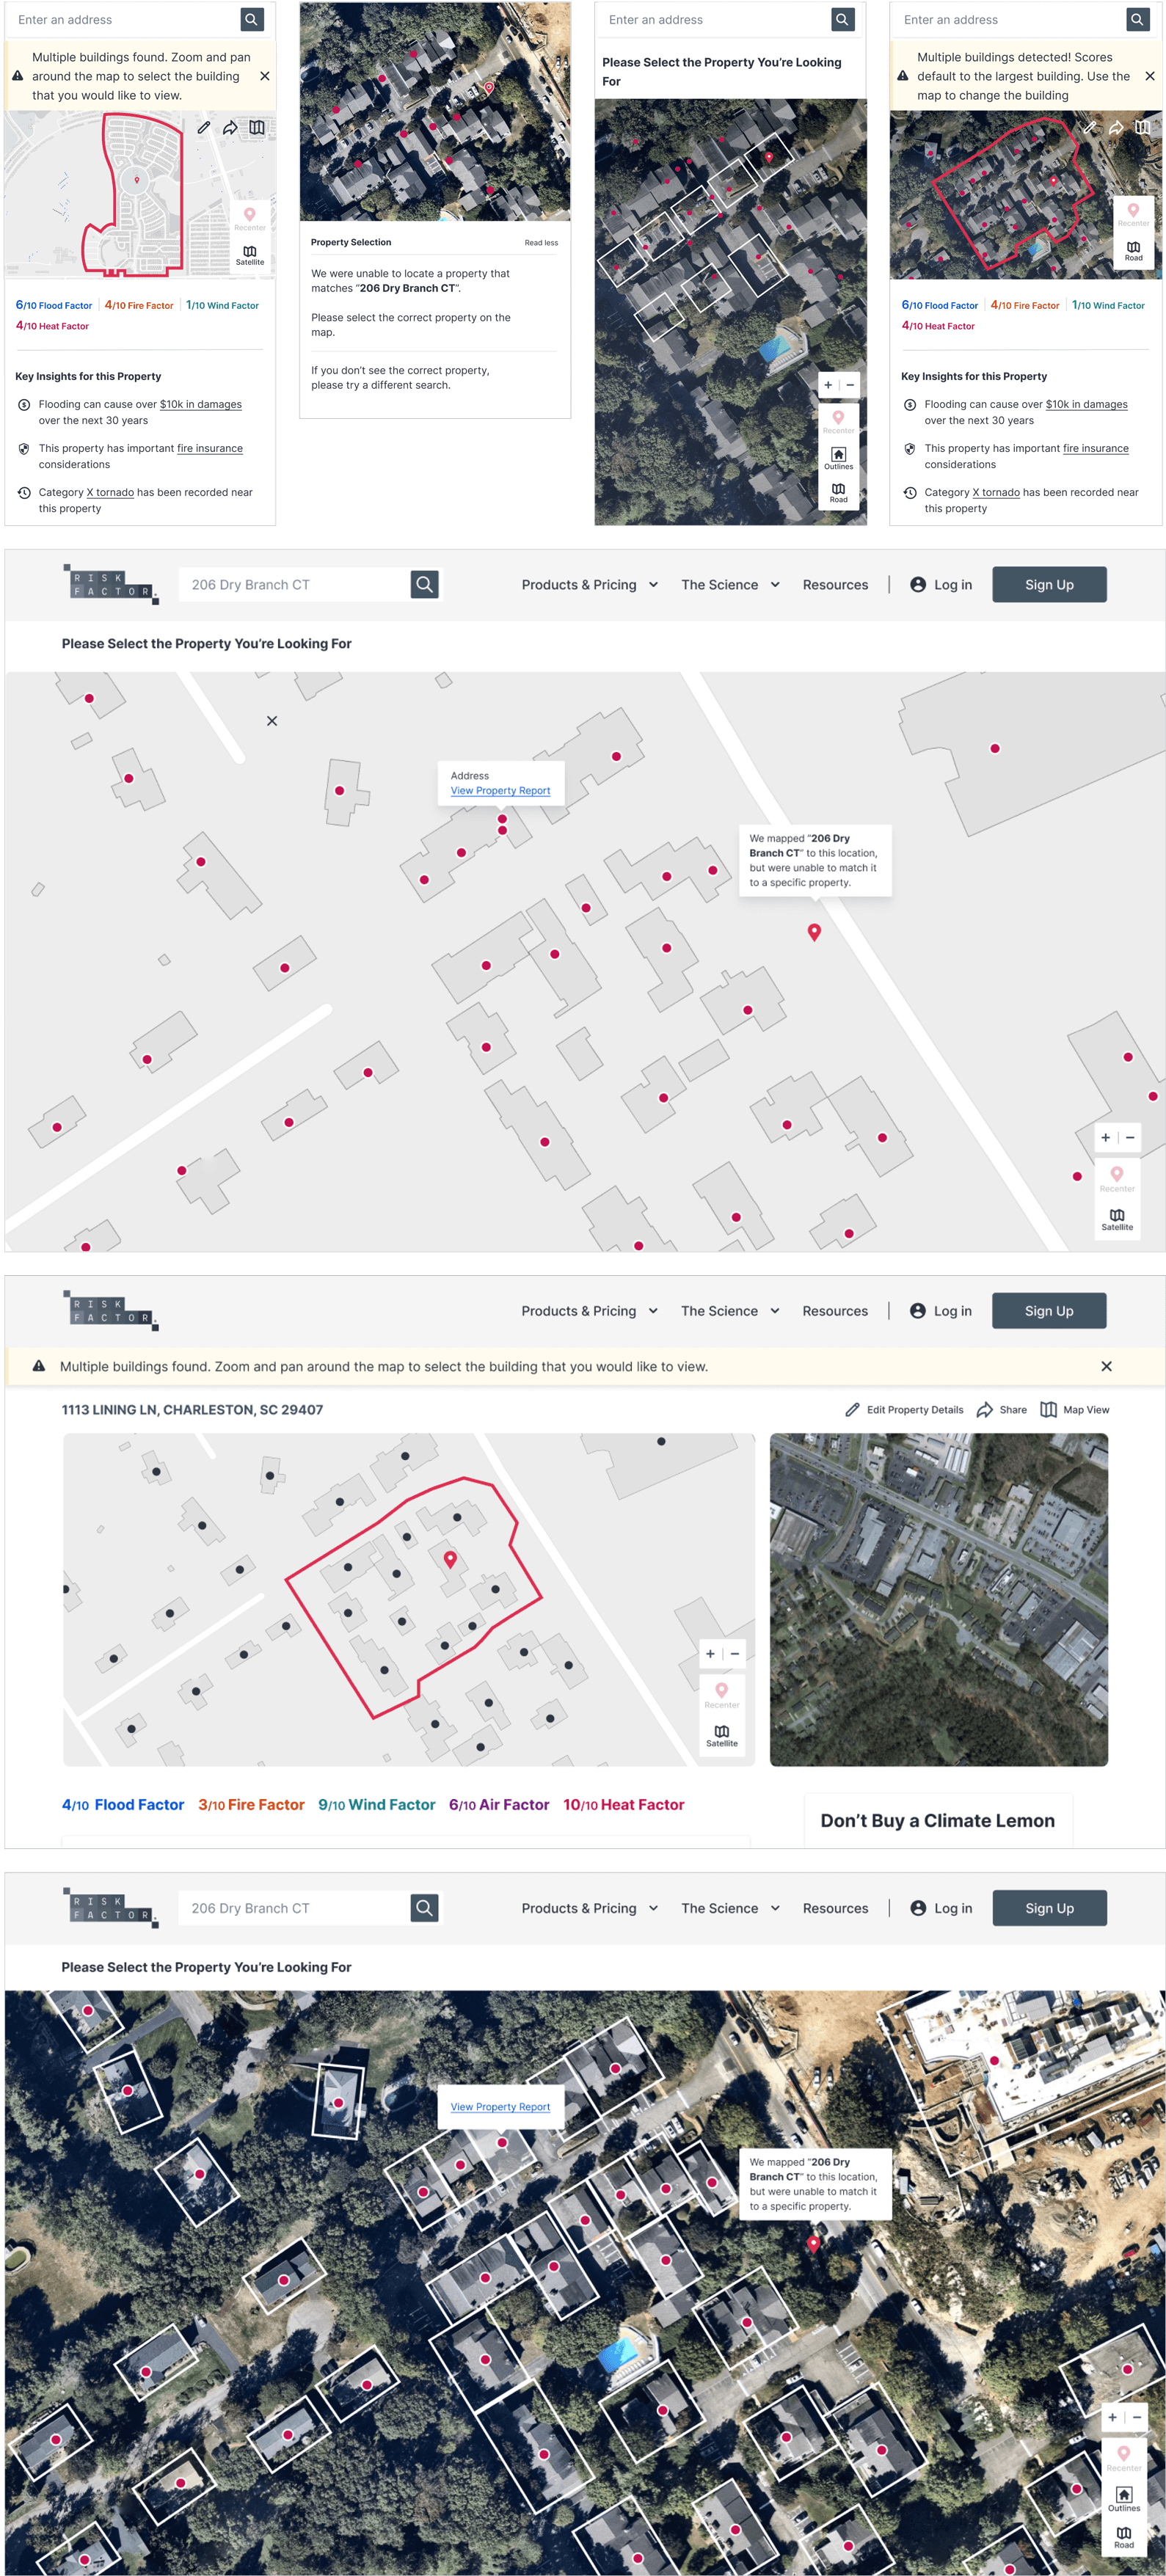
We explored various methods for highlighting multiple properties found on a single parcel. Utilizing visual cues such as clustering, color coding, and interactive overlays, we aimed to clearly distinguish between individual addresses within a multi-property parcel. This approach ensured users could quickly and accurately identify and select the desired properties, enhancing the overall usability and effectiveness of the Risk Factor platform.
Property Selection
Exploring property outlines, parcel outlines and property pins to ensure multiple property views.

Celebrating Success
Data Visualization
Data Simplification
Adaptive Design
Innovative Map Interactions Achieve Nationwide Coverage
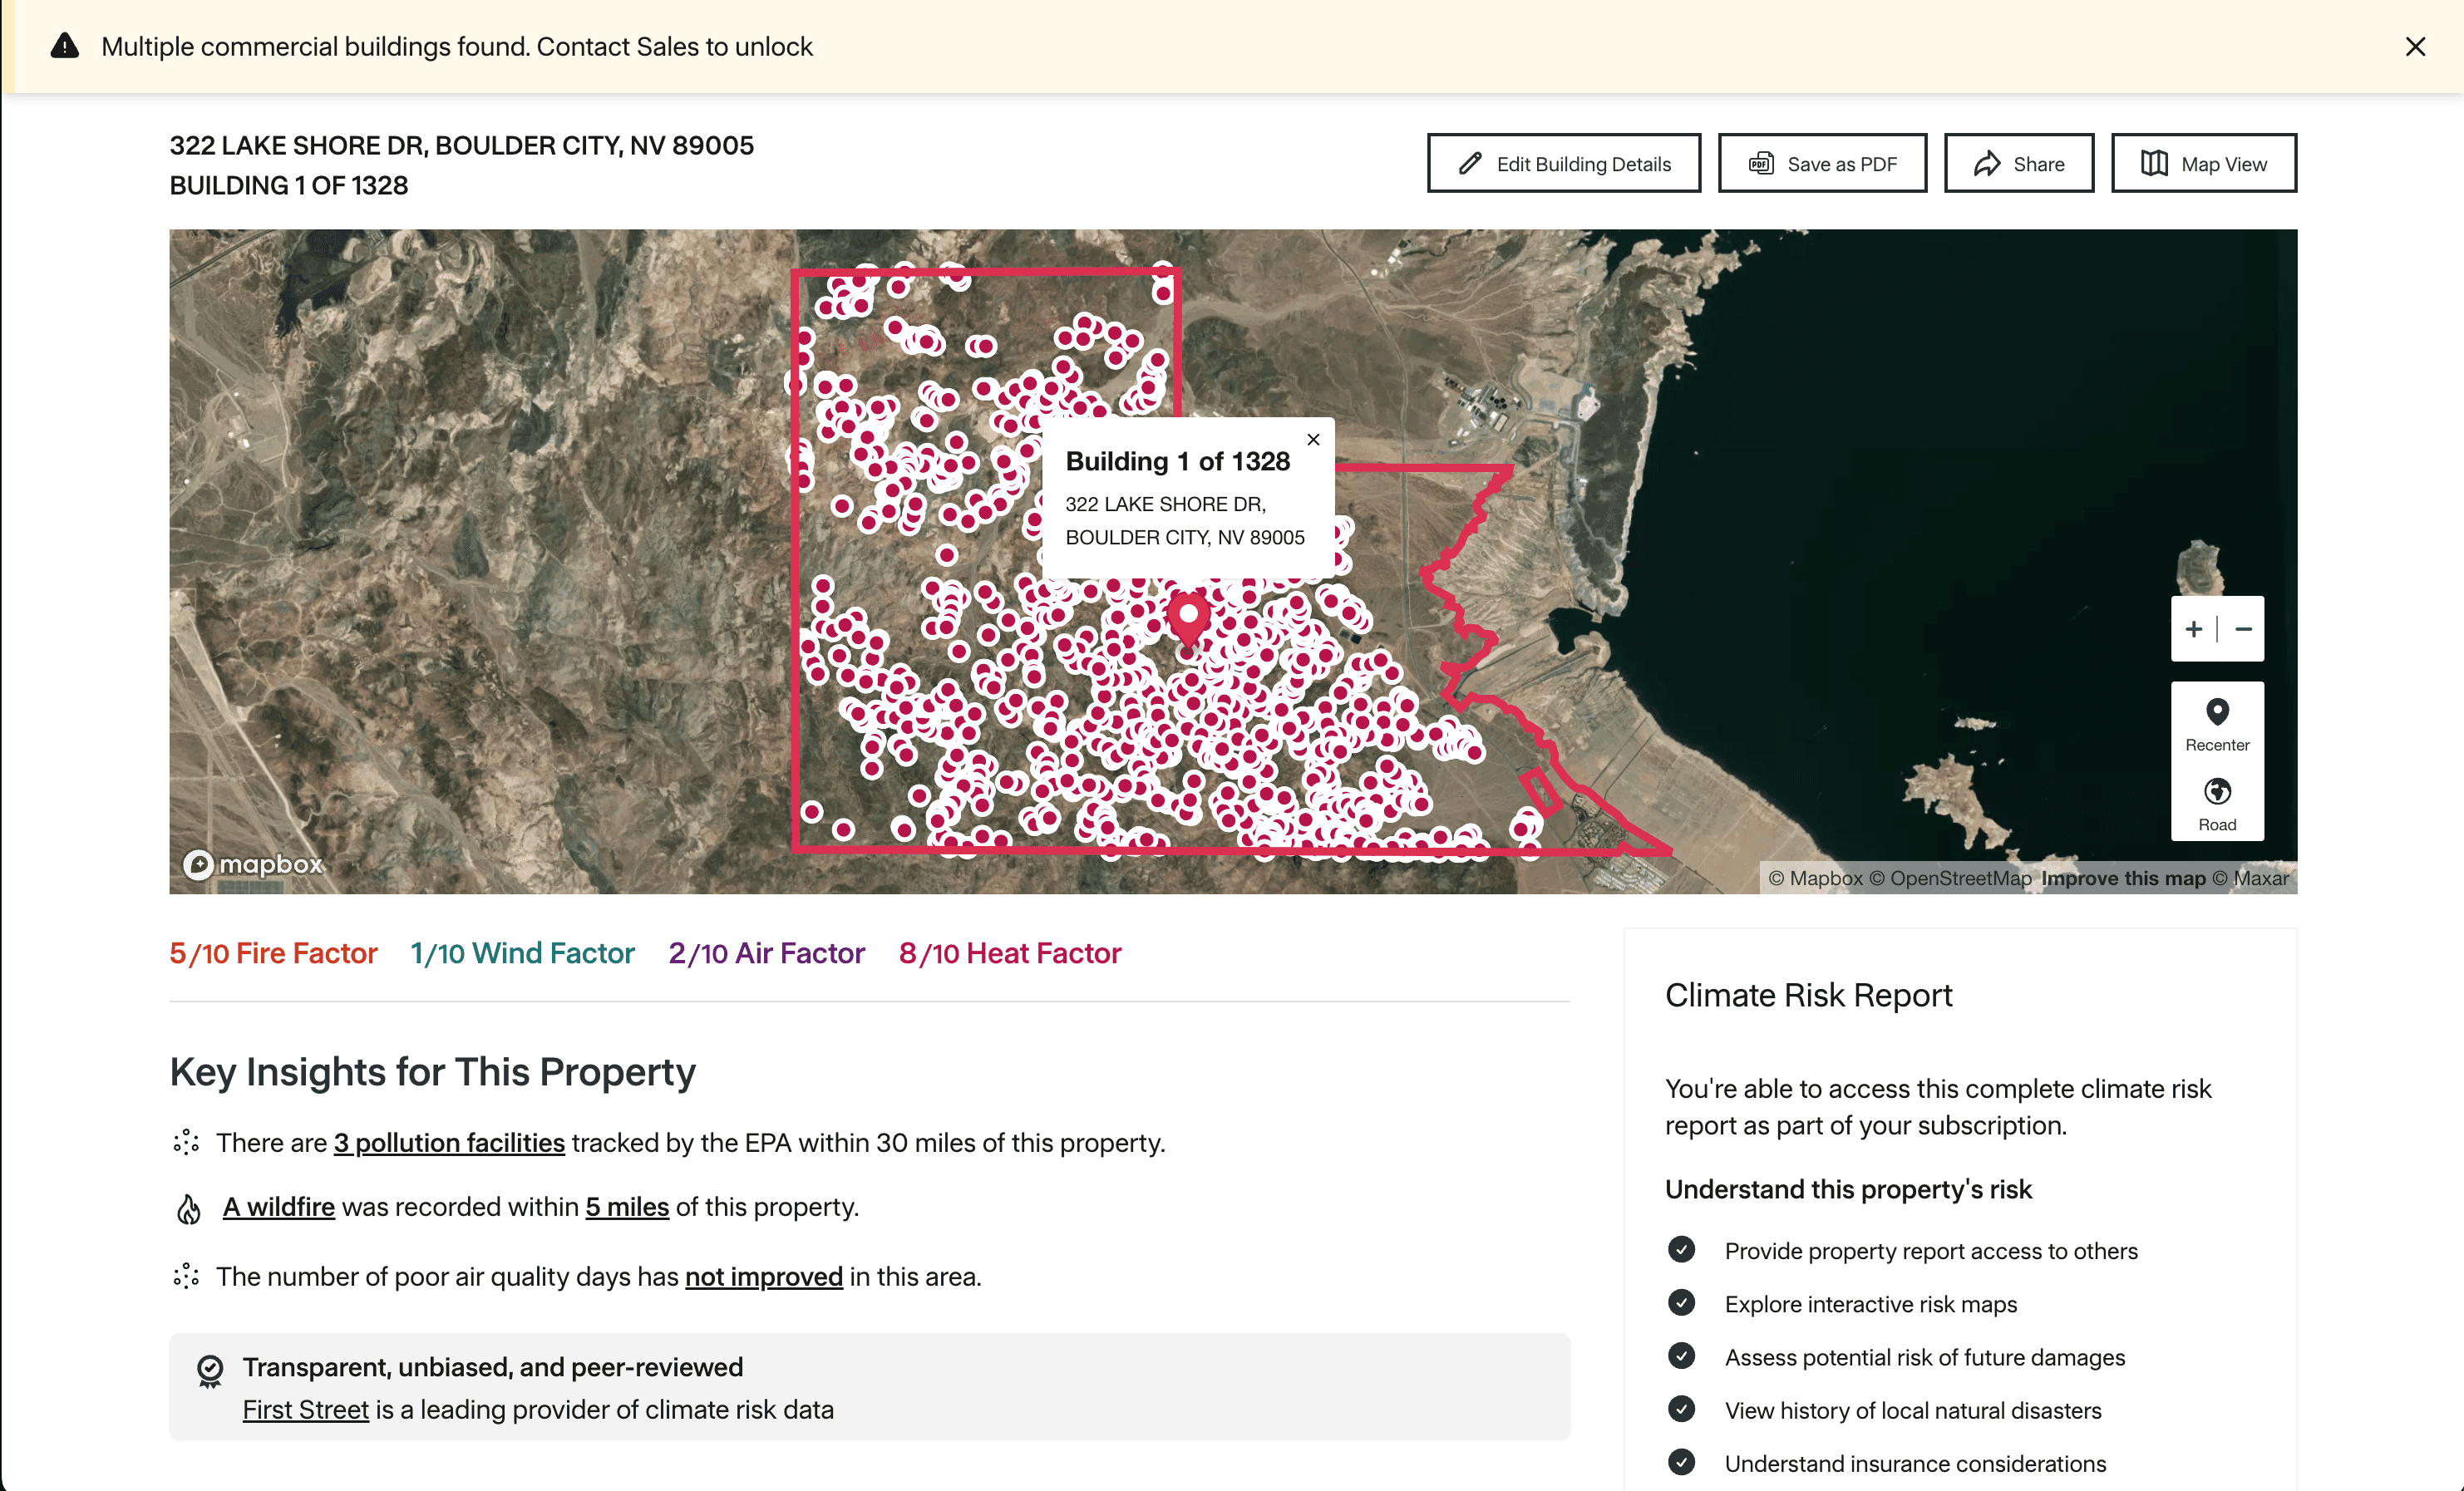
We developed an innovative solution using interactive map designs, enabling our key customers—banks and REITs (Real Estate Investment Trusts)—to efficiently locate and analyze properties. By incorporating advanced geolocation features, intuitive panning and zooming capabilities, and dynamic overlays, we ensured users could seamlessly navigate complex property data. The integration of clustering for multi-property parcels, precise pinning for individual properties, and clear property outlines enhanced the usability of the maps. These interactive elements empowered our customers to make well-informed investment decisions, significantly improving their ability to assess and manage property portfolios.
